
A 34-kilometre passage between Iran and Oman carries one-fifth of the world’s oil and a fifth of its traded natural gas. This is what it is, how it works, why it cannot be bypassed, and what its disruption costs the global economy.
Published: 4 April 2026 | Last updated: 4 April 2026
Twenty million barrels of oil pass through a single strip of water every day. That strip is 34 kilometres wide at its narrowest point. It connects the Persian Gulf, where most of the world’s major oil-producing nations sit, to the open ocean beyond. It is called the Strait of Hormuz, and the global energy system is built on the assumption that it stays open.
When that assumption breaks down, as it has since late February 2026, the consequences spread outward with a speed and reach unlike almost any other event in the global economy. Refineries cut output. Insurance premiums spike. Governments activate emergency reserves. Fuel prices rise in cities across Asia, Europe, and Africa within days. Inflation follows weeks later. Economies that thought they were distant from the conflict discover, quickly, that they are not.
The strait is not just a shipping lane. It is the central valve of the world’s energy infrastructure. Understanding what it is, and why closing it creates the effects it does, is necessary context for following almost every major economic story of 2026.
The Geography: One Exit From an Enclosed Sea
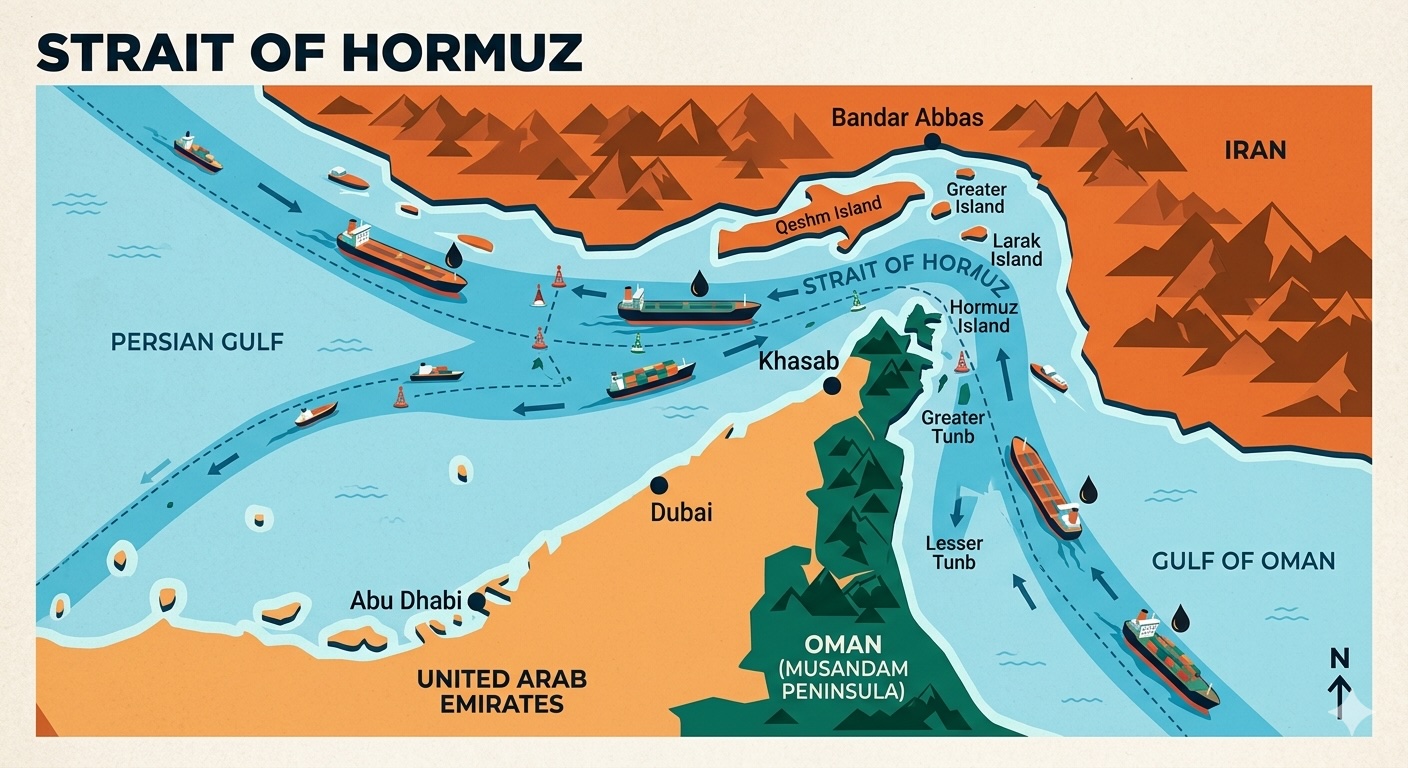
The Persian Gulf is a semi-enclosed body of water, roughly 990 kilometres long and no more than 340 kilometres wide, bordered by Iran to the north and the Arabian Peninsula to the south and west. Every major Gulf oil-producing nation sits on or within this enclosed sea: Saudi Arabia, Iraq, Kuwait, Qatar, the UAE, Bahrain, and Iran itself.
The gulf has exactly one outlet to the open ocean. That outlet is the Strait of Hormuz, a narrow passage running between the southern coast of Iran and the northern tip of Oman. Ships exiting the strait enter the Gulf of Oman, then the Arabian Sea, and from there can reach any port on earth.
On an average day, approximately 138 commercial vessels pass through the strait’s two shipping lanes, each about two miles wide and separated by a two-mile buffer zone, within a passage that measures 21 miles across at its narrowest point. The lanes operate on a one-way system: loaded tankers outbound on one side, empty or inbound ships on the other.
The decisive fact about this geography is not the width of the passage. It is the absence of alternatives. There is no other sea route out of the Persian Gulf. Countries that produce oil inside the gulf, and need to move it to customers in Asia, Europe, or elsewhere, must go through this one channel. Every other option, as discussed below, is partial, expensive, and slower.
The Scale: How Much Flows Through, and Where It Goes
In 2024, oil flow through the strait averaged 20 million barrels per day, equivalent to about 20 percent of global petroleum liquids consumption. Flows through the Strait of Hormuz in 2024 and the first quarter of 2025 made up more than one-quarter of total global seaborne oil trade.
To situate that number: global oil demand runs at roughly 103 million barrels per day, according to IEA estimates. One passage, controlled by geography and bordered on one side by Iran, accounts for a fifth of everything the world burns. The second-busiest oil chokepoint, the Strait of Malacca between Malaysia and Indonesia, handles around 16 million barrels per day. Hormuz carries more. And unlike Malacca, it is bordered by a nation that has repeatedly threatened to close it.
Natural gas flows compound the picture. Around one-fifth of global liquefied natural gas trade also transited the Strait of Hormuz in 2024, primarily from Qatar. Qatar is the world’s second-largest LNG exporter. Qatar shipped over 112 billion cubic metres of LNG in 2025, with approximately 93 percent of those volumes passing through the strait. There is no pipeline alternative for LNG. It must travel by tanker. For Qatar’s buyers, including major importers in Europe and Asia, there is no substitute route.
Where does all of this energy go? An estimated 84 percent of the crude oil and condensate and 83 percent of the liquefied natural gas that moved through the Strait of Hormuz went to Asian markets in 2024. China, India, Japan, and South Korea were the top destinations for crude oil, accounting for a combined 69 percent of all Hormuz crude flows.
Europe is less directly exposed on crude but is not insulated. Europe receives 12 to 14 percent of its LNG from Qatar, through the strait. And because oil is a globally priced commodity, a supply reduction anywhere raises the price paid everywhere. A refinery in Rotterdam that does not buy a single barrel of Gulf crude still pays more for its oil when the strait closes, because the global benchmark price has moved.
The strait is also a significant corridor for commodities beyond energy. Iran, Kuwait, Qatar, Saudi Arabia, and the UAE combined to produce almost a quarter of the world’s supply of sulfur in 2025. Some of this production is exported by sea through the Strait. The Middle East region is estimated to produce about half the world’s seaborne supply of sulfuric acid. Africa, in particular, relies on sulfuric acid from this region to leach out critical minerals in its mining operations. A prolonged closure disrupts supply chains in industries far beyond energy.
The Producers: Who Depends on the Strait to Sell Their Oil
Based on tanker tracking data published by Vortexa, Saudi Arabia moves more crude oil and condensate through the Strait of Hormuz than any other country. In 2024, exports of crude and condensate from Saudi Arabia accounted for 38 percent of total Hormuz crude flows, at 5.5 million barrels per day.
Iraq, Kuwait, the UAE, Qatar, and Iran together account for most of the rest. Every one of these nations depends on the strait not merely as a trade route but as the primary source of government revenue. Saudi Arabia funds its entire state budget from oil exports. Iraq’s public finances are overwhelmingly dependent on oil sales. Qatar’s LNG wealth, which underpins its sovereign wealth fund and its regional influence, leaves through this single passage.
This creates the central paradox of Hormuz geopolitics. Iran borders the strait to the north. Its coastline runs along much of the passage. Its Revolutionary Guard Corps has for decades maintained the naval capability to threaten, harass, or physically obstruct shipping through it. And Iran has explicitly threatened to close the strait on multiple occasions when it has faced military pressure or tightening sanctions.
The paradox is that closure harms Iran’s Gulf neighbours far more than it harms the Western economies Iran is typically attempting to coerce. Saudi Arabia, Iraq, Kuwait, and the UAE would lose their export revenues. The United States, which has significantly reduced its Gulf oil dependency in recent years, would feel the effects primarily through rising domestic fuel prices rather than a physical supply cutoff. The countries that would suffer most acutely from a prolonged closure are in Asia, not the West.
The Bypass Options: Why They Are Not Enough
The world has known for decades that Hormuz represents a critical vulnerability. Bypass routes exist. They are not adequate.
Only Saudi Arabia and the UAE have operational crude pipelines that could potentially re-route flows to bypass the Strait of Hormuz, with an estimated 3.5 to 5.5 million barrels per day of available capacity. The logistics and supply chains needed to re-route and export substantial flows have not been robustly tested.
Saudi Arabia’s East-West Crude Oil Pipeline, the Petroline, runs from oil fields on the Gulf coast across the Arabian Peninsula to the Red Sea port of Yanbu. Saudi Arabia’s East-West pipeline has a design capacity of 5 million barrels per day, with Aramco reporting an expanded capacity of 7 million barrels per day as of March 2025, though sustainable flows have not been tested at that level, and roughly 2 million barrels per day was already in use as of early 2026, leaving an estimated 3 to 5 million barrels per day of spare capacity.
The UAE operates a pipeline running to the port of Fujairah on the Arabian Sea coast, which sits outside the strait and provides a limited but real bypass for UAE crude. Iraq has access to the Kirkuk-Ceyhan pipeline running through Turkey to the Mediterranean, though volumes are constrained.
The combined capacity of these pipelines is unable to match the amount of oil shipped through the strait, at roughly 9 million barrels per day compared to 20 million. The gap is not closeable in the short or medium term. Pipelines take years to build. The existing infrastructure was sized for normal commercial diversification, not for emergency replacement of the world’s most important shipping lane.
Saudi Arabia’s Yanbu route also introduces a second vulnerability. Ships exiting Yanbu transit the Red Sea, which has faced repeated Houthi attacks on commercial vessels. According to reporting by multiple outlets, Houthi-controlled Yemen resumed attacks on commercial shipping in late February 2026. The bypass, in other words, leads into another contested waterway.
Iran attempted to build its own bypass to reduce its dependence on the passage it also controls. Iran’s Jask oil terminal was officially inaugurated in 2021 to transport crude oil from the Goreh-Jask pipeline to Jask on the Gulf of Oman. However, the pipeline and port effectively remain non-operational. A test load was exported from Jask in late 2024, but no further oil has been exported from Jask since then.
The conclusion is straightforward. There is no realistic bypass combination that replaces Hormuz at scale. A prolonged closure does not redirect global oil supply. It reduces it.
What Disruption Looks Like: The 2026 Closure in Numbers
Since 28 February 2026, when the United States and Israel launched coordinated strikes on Iran, Iran’s Revolutionary Guard Corps shut the strait to Western-allied shipping. On 7 March, a single commercial vessel transited the strait. Zero oil tankers. The historical daily average is 138 ships.
Tanker traffic dropped first by approximately 70 percent, with over 150 ships anchoring outside the strait to avoid risks. Subsequently traffic dropped to about zero. This disruption affected about 20 percent of the world’s daily oil supply and significant volumes of LNG.
The insurance markets registered the shift immediately. War-risk ship insurance premiums for the strait increased from 0.125 percent to between 0.2 and 0.4 percent of the ship insurance value per transit. For very large oil tankers, this represents an increase of a quarter of a million dollars per voyage.
QatarEnergy declared force majeure at Ras Laffan, the world’s largest LNG liquefaction facility. Subsequent strikes on the facility knocked out approximately 17 percent of Qatar’s LNG export capacity, with QatarEnergy’s CEO telling Reuters the damage will sideline 12.8 million tonnes per year for three to five years.
The LSE Business Review observed that a short closure of the strait constitutes an oil shock, while a prolonged closure becomes an inflation and growth shock. The difference between the two is time.
Analysis: Who Bears the Heaviest Economic Cost
The following section is clearly labelled as editorial analysis and represents interpreted assessment of reported facts, not established fact.
The immediate effects of a Hormuz closure are concentrated in Asia, because that is where most of the oil goes. China, India, Japan, and South Korea collectively take the majority of the strait’s outbound cargo. All four have large, energy-intensive economies and limited short-term substitution options. India is especially exposed: it imports roughly 80 percent of its oil, and a significant share comes from Gulf producers whose only export route runs through the strait.
Asia is particularly reliant on oil and gas from the Gulf, with around 60 percent of its crude oil imports and nearly a third of its LNG moving through the strait. Almost all countries in the region import most of their fuel and gas, and some only have enough supplies to last a few weeks. Several Southeast Asia-based refineries, including facilities in Singapore and Malaysia, have cut back output due to constrained crude availability. Panic fuel-buying has spread to the Philippines, Indonesia, Thailand, Vietnam, and Myanmar.
Europe faces a different but real exposure. The continent has diversified its gas supply substantially since 2022, adding US LNG and Norwegian pipeline flows. But it remains partly dependent on Qatari LNG, and its industrial energy costs are now rising in response to the global price movement, regardless of where individual cargoes originate.
For smaller, import-dependent developing economies, the exposure is categorically more severe. Countries with thin foreign exchange reserves, limited domestic energy production, and high fuel import dependency face a compounding crisis: higher oil prices drain reserves, a weakening currency makes imports more expensive still, and reduced fiscal space limits the government’s ability to subsidise fuel or protect households. Sri Lanka, Pakistan, and Bangladesh have all been identified by analysts as sitting in this most vulnerable category. The Atlantic Council and The Diplomat have reported directly on the convergence of these pressures across South Asia.
The broader economic transmission works through three channels. The first is direct fuel cost: oil prices rise, petrol and diesel become more expensive, logistics costs climb, and consumer prices follow. The second is inflation expectations: businesses and workers reprice contracts in anticipation of continued increases, which can embed inflation even if prices later fall. The third is financial contagion: currency weakness in commodity-importing emerging markets leads to capital outflows, higher borrowing costs, and in the most vulnerable cases, difficulty servicing external debt.
Analysts have noted that the world’s ability to cushion the current disruption is not unlimited. Emergency petroleum reserve releases by IEA member countries provide a buffer, but that buffer is measured in weeks, not months. If commercially credible shipping through the strait does not resume within that window, the global economy moves from managing a price shock to managing a structural supply shortage.
What to Watch
For readers following the economic consequences of the Hormuz disruption, the indicators that matter most are:
The Brent crude spot price, which serves as the global oil benchmark and directly reflects market assessments of supply adequacy. A sustained price above 90 or 100 dollars per barrel signals that markets believe the disruption will be prolonged.
The status of emergency reserve releases by IEA member countries, which represent the primary short-term buffer against supply shortfalls.
Shipping insurance premium movements, which are a leading indicator of whether commercial carriers consider the strait passable.
QatarEnergy statements on LNG operations at Ras Laffan, which will determine how much of the global gas supply shortfall is temporary and how much reflects lasting damage to export infrastructure.
Central bank statements in major Asian economies, particularly India, Japan, and South Korea, which will signal how monetary authorities are assessing the inflationary risk from sustained energy price rises.
For countries in the most exposed category, including several South Asian economies, the specific variables to monitor are foreign exchange reserve levels, currency movements against the dollar, and any changes to IMF programme conditions that might be triggered by deteriorating external accounts.
Global War News will continue reporting on each of these as the situation develops.
Sources used in this article: U.S. Energy Information Administration (EIA), “Amid regional conflict, the Strait of Hormuz remains critical oil chokepoint,” June 2025; International Energy Agency (IEA), “Key Factors on the Strait of Hormuz and Oil and Gas Markets,” February 2026; Congressional Research Service (CRS), “Iran Conflict and the Strait of Hormuz: Impacts on Oil, Gas, and Other Commodities,” March 2026; LSE Business Review, “Disruption in the Strait of Hormuz is a global inflation, shipping and growth story,” March 2026; The Diplomat, “South Asia’s LNG Strategy Was Built for the Last Crisis — Not This One,” March 2026; Atlantic Council, “Demand destruction has begun: What Sri Lanka reveals about the global energy crisis,” March 2026; Speed Commerce, “How much of the world’s shipping and oil goes through the Strait of Hormuz?” March 2026; IEA, “Strait of Hormuz,” country and chokepoint briefing, 2026.
This article is based on publicly available reporting from named international news agencies and attributed official statements. All claims about ongoing events are attributed to their original sources. Analysis sections represent the editorial interpretation of reported facts and do not constitute advocacy for any party to the described conflict. This publication does not take political positions on active military conflicts.